Background
At HippoLine, we use SentinelOne to detect software on our computers with known vulnerabilities or exploits in them, in order to keep everything as secure as possible. While this is a very important and often time sensitive process, our current setup does not allow us to alert employees when new vulnerabilities are found on their laptops. A colleague has to export, filter, and send out vulnerability reports manually, which makes it not feasible to do this daily. This blog describes how i automated this process, saving hours of work every month, and making our entire company more ISO compliant, and more importantly, more protected against cyber attacks.
Since we are a Qlik based company, I researched the options for sending out daily & weekly reports using Qlik Automate. It has a built in Reporting connector, which sounds like the right tool for the job. But in reality, it's way too limited; tables are put into a pdf as if they're screenshots, meaning that if there are more rows than fit on a single page, those rows are cut off. There is also currently no way to change the styling or layout, and while aesthetics weren't a priority, this still impacted the usefulness negatively. With my affinity for website building, I noticed that Qlik offers both HTML and PixelPerfect capabilities. While this seemed like a better fit, support was lacking for conditional formatting and email sending logic.
So I came up with my own solution, using Qlik Automate to conditionally build up a HTML page using variables, which would go directly into the body of an email; no attachment or link required.
Implementation
Qlik Automations work and look like a flowchart diagram, using blocks to gather data directly from Qlik apps, which you can then process and apply logic to in order to perform certain tasks. The nice thing about this is that you can make selections as if you're inside your Qlik dashboard, which means you only have to model the data once inside the app.
The main idea of the automation is to append rows of vulnerabilities and information about them to variables, which can then be inserted into standard variables containing things like the <html> tag and the headers, which will be the same between reports. This allows full control over the styling, as we can use regular CSS, as well as the logic of which vulnerabilities show up where.
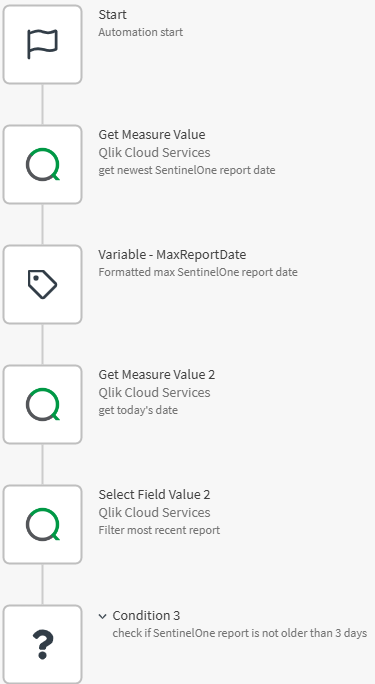
To start, I compare the date of the most recent report to today, to make sure we never send out an email about the same report multiple times.
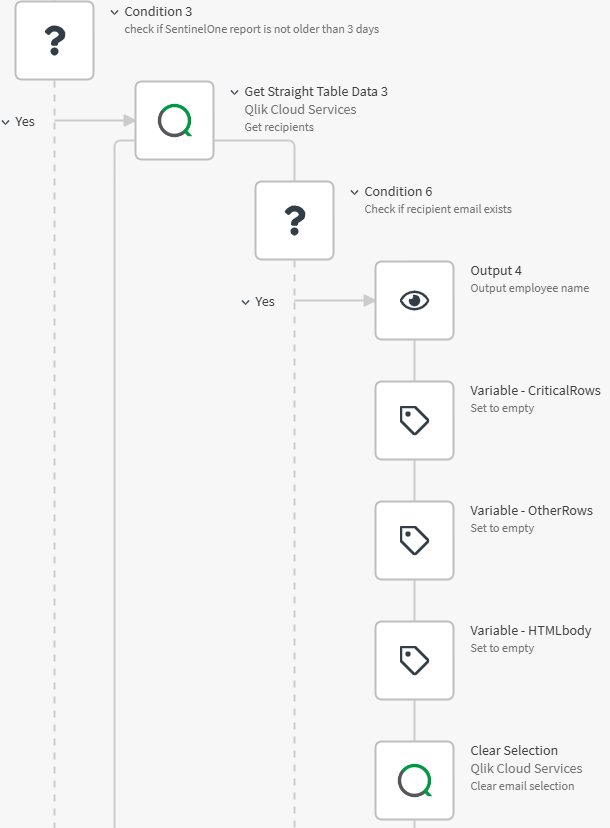
Now we begin the first of the main loops, which ensures we send a separate, personalized report for each employee. At the start of each iteration, the variables holding our HTML are emptied, so they can be filled again. Because vulnerabilities are appended, if we didn't do this, every employee would receive their own vulnerabilities, plus the ones of the employees before them.
Throughout this automation you will see output blocks. These aren't functionally necessary, but help with troubleshooting and monitoring that the automation is doing what we expect.
Some employees have multiple laptops, for example due to recently transitioning to a new one, so we split the vulnerabilities per device. Counts are extracted to show how many vulnerabilities exist at a quick glance.